
| DeutscheáVersion |
The sound pressure variation is the instantaneous acoustic pressure as RMS value.
| Voltage or sound pressure ratio |
Power or intensity ratio |
← − dB + → | Voltage or sound pressure ratio |
Power or intensity ratio |
| 1.000 | 1.000 | 0 | 1.000 | 1.000 |
| 0.989 | 0.977 | 0.1 | 1.012 | 1.023 |
| 0.977 | 0.955 | 0.2 | 1.023 | 1.047 |
| 0.966 | 0.933 | 0.3 | 1.035 | 1.072 |
| 0.955 | 0.912 | 0.4 | 1.047 | 1.096 |
| 0.944 | 0.891 | 0.5 | 1.059 | 1.122 |
| 0.933 | 0.871 | 0.6 | 1.072 | 1.148 |
| 0.923 | 0.851 | 0.7 | 1.084 | 1.175 |
| 0.912 | 0.832 | 0.8 | 1.096 | 1.202 |
| 0.902 | 0.813 | 0.9 | 1.109 | 1.230 |
| 0.891 | 0.794 | 1.0 | 1.122 | 1.259 |
| 0.841 | 0.708 | 1.5 | 1.189 | 1.413 |
| 0.794 | 0.631 | 2.0 | 1.259 | 1.585 |
| 0.750 | 0.562 | 2.5 | 1.334 | 1.778 |
| 0.707 | 0.501 | 3.0 | 1.413 | 1.995 |
| 0.668 | 0.447 | 3.5 | 1.496 | 2.239 |
| 0.631 | 0.398 | 4.0 | 1.585 | 2.512 |
| 0.596 | 0.355 | 4.5 | 1.679 | 2.818 |
| 0.562 | 0.316 | 5.0 | 1.778 | 3.162 |
| 0.531 | 0.282 | 5.5 | 1.884 | 3.548 |
| 0.501 | 0.250 | 6.0 | 1.995 | 4.000 |
| 0.473 | 0.224 | 6.5 | 2.113 | 4.467 |
| 0.447 | 0.200 | 7.0 | 2.239 | 5.012 |
| 0.422 | 0.178 | 7.5 | 2.371 | 5.623 |
| 0.398 | 0.159 | 8.0 | 2.512 | 6.310 |
| 0.376 | 0.141 | 8.5 | 2.661 | 7.079 |
| 0.355 | 0.126 | 9.0 | 2.818 | 7.943 |
| 0.335 | 0.112 | 9.5 | 2.985 | 8.913 |
| 0.316 | 0.100 | 10 | 3.162 | 10.00 |
| 0.282 | 0.0794 | 11 | 3.55 | 12.6 |
| 0.251 | 0.0631 | 12 | 3.98 | 15.8 |
| 0.224 | 0.0501 | 13 | 4.47 | 20.0 |
| 0.199 | 0.0398 | 14 | 5.01 | 25.1 |
| 0.178 | 0.0316 | 15 | 5.62 | 31.6 |
| 0.159 | 0.0251 | 16 | 6.31 | 39.8 |
| 0.141 | 0.0200 | 17 | 7.08 | 50.1 |
| 0.126 | 0.0159 | 18 | 7.94 | 63.1 |
| 0.112 | 0.0126 | 19 | 8.91 | 79.4 |
| 0.100 | 0.0100 | 20 | 10.0 | 100.0 |
| 3.16×10⁻² | 10−3 | 30 | 3.16×10 | 103 |
| 10−2 = 0.01 | 10−4 | 40 | 102 = 100 | 104 |
| 3.16×10⁻³ | 10−5 | 50 | 3.16×10² | 105 |
| 10−3 = 0.001 | 10−6 | 60 | 103 = 1000 | 106 |
| 3.16×10⁻⁴ | 10−7 | 70 | 3.16×10³ | 107 |
| 10−4 | 10−8 | 80 | 104 | 108 |
| 3.16×10⁻⁵ | 10−9 | 90 | 3.16×10⁴ | 109 |
| 10−5 | 10−10 | 100 | 105 | 1010 |
| 3.16×10⁻⁶ | 10−11 | 110 | 3.16×10⁵ | 1011 |
| 10−6 | 10−12 | 120 | 106 | 1012 |
Field quantity (size) − Voltage
| To use the calculator, simply enter a value. The calculator works in both directions of the ↔ sign. |
Energy quantity (size) − Power
For dBm it was decided the reference power P1 or P0 = 1 milliwatt = 0.001 watt (≡ 0 dB).
| Electric power (telephone) P watts |
↔ | Electric Power level LP dBm |
|
| Reference power P0 = 1 milliwatt (mW) = 0.001 W ≡ 0 dBm | |||
 |
 |
|
| Level of field quantities |
Level of energy quantities |
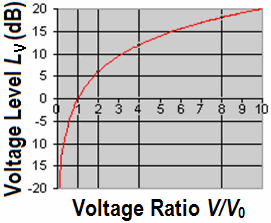
| We are mainly concerned with conditions of sound pressure, sound velocity, and audio voltage that are field quantities. Voltage level is: LV = 20 × log10(V1 / V0) Voltage is: V1 = V0 × 10(LV / 20) Reference voltage V0 = 1 Volt. |
| Sound Field Quantities Sound pressure, sound or particle velocity, particle displacement or displacement amplitude, (voltage, current, electric resistance). Inverse Distance Law 1/r |
Sound Energy Quantities Sound intensity, sound energy density, sound energy, acoustic power. (electrical power). Inverse Square Law 1/r² |
| Decibel scale for linear field quantities, like volts and sound pressures |
 |
| The logarithmic scale (ratio) |
 |
referred to 0.7746 volt in dBu and to 1 volt in dBV
Conversion of decibel to voltage re 0.7746 volt and re 1 volt
| Voltageáre 0.7746ávolt |
Voltageáre 1ávolt |
← − dB + → | Voltageáre 0.7746ávolt |
Voltageáre 1ávolt |
| 0.775 | 1.000 | 0 | 0.775 | 1.000 |
| 0.766 | 0.989 | 0.1 | 0.784 | 1.012 |
| 0.757 | 0.977 | 0.2 | 0.793 | 1.023 |
| 0.748 | 0.966 | 0.3 | 0.802 | 1.035 |
| 0.740 | 0.955 | 0.4 | 0.811 | 1.047 |
| 0.731 | 0.944 | 0.5 | 0.820 | 1.059 |
| 0.723 | 0.933 | 0.6 | 0.830 | 1.072 |
| 0.715 | 0.923 | 0.7 | 0.840 | 1.084 |
| 0.706 | 0.912 | 0.8 | 0.849 | 1.096 |
| 0.698 | 0.902 | 0.9 | 0.859 | 1.109 |
| 0.690 | 0.891 | 1.0 | 0.869 | 1.122 |
| 0.652 | 0.841 | 1.5 | 0.921 | 1.189 |
| 0.615 | 0.794 | 2.0 | 0.975 | 1.259 |
| 0.581 | 0.750 | 2.5 | 1.033 | 1.334 |
| 0.548 | 0.707 | 3.0 | 1.095 | 1.414 |
| 0.518 | 0.668 | 3.5 | 1.159 | 1.496 |
| 0.489 | 0.631 | 4.0 | 1.228 | 1.585 |
| 0.461 | 0.596 | 4.5 | 1.300 | 1.679 |
| 0.436 | 0.562 | 5.0 | 1.377 | 1.778 |
| 0.411 | 0.531 | 5.5 | 1.459 | 1.884 |
| 0.388 | 0.501 | 6.0 | 1.549 | 1.995 |
| 0.367 | 0.473 | 6.5 | 1.637 | 2.113 |
| 0.346 | 0.447 | 7.0 | 1.734 | 2.239 |
| 0.327 | 0.422 | 7.5 | 1.837 | 2.371 |
| 0.308 | 0.398 | 8.0 | 1.946 | 2.512 |
| 0.291 | 0.376 | 8.5 | 2.061 | 2.661 |
| 0.275 | 0.355 | 9.0 | 2.183 | 2.818 |
| 0.259 | 0.335 | 9.5 | 2.312 | 2.985 |
| 0.245 | 0.316 | 10 | 2.449 | 3.162 |
| 0.218 | 0.282 | 11 | 2.748 | 3.548 |
| 0.195 | 0.250 | 12 | 3.084 | 3.981 |
| 0.173 | 0.224 | 13 | 3.460 | 4.467 |
| 0.155 | 0.199 | 14 | 3.882 | 5.012 |
| 0.138 | 0.178 | 15 | 4.356 | 5.623 |
| 0.123 | 0.159 | 16 | 4.887 | 6.310 |
| 0.109 | 0.141 | 17 | 5.484 | 7.079 |
| 0.097 | 0.129 | 18 | 6.153 | 7.943 |
| 0.086 | 0.112 | 19 | 6.904 | 8.912 |
| 0.077 | 0.100 | 20 | 7.746 | 10.000 |
| 2.450×10⁻² | 3.162×10⁻² | 30 | 24.50 | 31.62 |
| 7.746×10⁻³ | 10−2 | 40 | 77.46 | 102 |
| 2.450×10⁻³ | 3.162×10⁻³ | 50 | 2.450×10² | 3.162×10² |
| 7.746×10⁻⁴ | 10−3 | 60 | 7.746×10² | 103 |
| 2.450×10⁻⁴ | 3.162×10⁻⁴ | 70 | 2.450×10³ | 3.162×10³ |
| 7.746×10⁻⁵ | 10−4 | 80 | 7.746×10³ | 104 |
| 2.450×10⁻⁵ | 3.162×10⁻⁵ | 90 | 2.450×10⁴ | 3.162×10⁴ |
| 7.746×10⁻⁶ | 10−5 | 100 | 7.746×10⁴ | 105 |
| 2.450×10⁻⁶ | 3.162×10⁻⁶ | 110 | 2.450×10⁵ | 3.162×10⁵ |
| 7.746×10⁻⁷ | 10−6 | 120 | 7.746×10⁵ | 106 |
Audio voltage and level
| To use the calculator, simply enter a value. The calculator works in both directions of the ↔ sign. |
| Note - Comparing dBSPL and dBA: There is no conversion formula for measured dBA values to sound pressure level dBSPL or vice versa. That is only possible measuring one single frequency. There is no "dBA" curve given as threshold of human hearing. Readings of a pure 1 kHz tone should be identical, whether weighted or not. |
| Pro audio equipment often lists an A-weighted noise spec – not because it correlates well with our hearing – but because it can "hide" nasty hum components that make for bad noise specs. Words to bright minds: Always wonder what a manufacturer is hiding when they use A-weighting. *) |
*) http://www.google.com/search?q=Always+wonder+what+a+manufacturer+Rane&filter=0
Sound measuring (Noise measuring) with weighting filter A and C
|
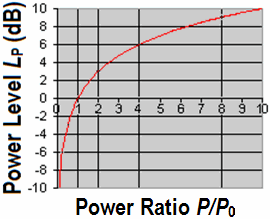
If the output voltage level is 0 dB, that is 100%, the level of −3 dB is equivalent to 70.7% and the level of −6 dB is equivalent to 50% of the initial output voltage. This applies to all field quantities; e.g. sound pressure. If the output power level is 0 dB, that is 100%, the level of −3 dB is equivalent to 50% and −6 dB is equivalent to 25% of the initial output power. This applies to all energy quantities; e.g. sound intensity. Try to understand this. |
Different equations in books −
RMS or peak value?
| The sound intensity I in W/m2 in a plane progressive wave
is given as: But only one equation can be correct. Sometimes, these equations will show further information:   The tilde will indicate that it is the RMS value and the roof will show that it is the amplitude value, ie, the peak value. For sinusoidal signals, the peak value means the amplitude. With these more accurate data, both equations are correct. You just need to know exactly whether the peak value or the RMS value is applied. Sound pressure p in Pa = N/m2 − particle velocity v in m/s − acoustic intensity I in N/m2 · m/s = W/m² Energy equivalent: J (joule) = N · m = W · s In audio engineering we always assume RMS values, if not specially noted different. |
| Simple rule of thumb: When working with power, 3 dB is twice, 10 dB is 10 times. When working with voltage or current, 6 dB is twice, 20 dB is 10 times |
| back |
Search engine |
home |